
Understanding Maven Trading for Kenyan Investors
Discover how Maven Trading operates in Kenya's markets 📈, its investment role, key strategies, and what Kenyan investors must know before starting their journey 🌍.
Edited By
Sophie Turner
TradingView charts have become a popular tool among Kenyan traders and investors for analysing financial markets like stocks, forex, and cryptocurrencies. Whether you trade actively or just follow market movements, understanding how to read and use TradingView charts can greatly improve your decision-making.
The platform offers clear and interactive charts that provide a lot more than just price movement. It combines real-time data with technical indicators, drawing tools, and customisable layouts, helping you spot trends, identify entry and exit points, and manage risk better.
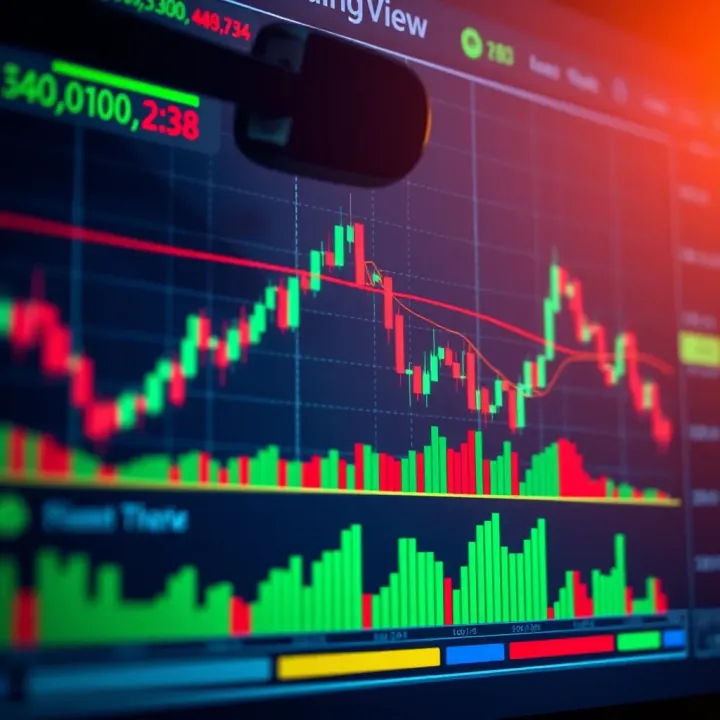
For example, suppose you're tracking Safaricom shares on the NSE. Using TradingView, you can apply the Relative Strength Index (RSI) to see if the stock is overbought or oversold. Or, you might use moving averages to confirm if the current price trend is upward or downward.
Knowing how to navigate these features gives you a real edge. Instead of relying only on news or tips, you get a visual and analytical edge that reflects market dynamics instantly.
Here are some key points beginners should focus on:
Chart types: Candlestick charts are most used since they provide information on open, close, high, and low prices for each time segment.
Timeframes: Daily and weekly charts suit long-term investors, while 5-minute or 15-minute charts serve active day traders.
Technical indicators: Popular ones in Kenya include RSI, Moving Average Convergence Divergence (MACD), and Bollinger Bands.
Drawing tools: Support and resistance lines, trendlines, and Fibonacci retracements help identify price levels that matter.
Once you grasp these basics and learn how to customise your charts on TradingView, you get a reliable reference to make smarter trades or investments. Remember, the Kenyan market can be volatile, so charts combined with fundamental analysis and local market knowledge create a strong toolkit.
Next, we will explore how to use the platform’s interface effectively, highlight features suited for Kenyan investors, and show practical steps for analysis.
TradingView is a widely used platform among traders and investors worldwide, and Kenyan traders benefit from its versatility and ease of use. Getting started with TradingView charts is the first step toward better market analysis. With the platform's user-friendly interface and powerful tools, you can quickly begin tracking stocks, forex, and cryptocurrencies. This section covers what TradingView is, why its charts stand out, and how to access and set up your first chart.
TradingView is an online tool that offers interactive charts for financial markets. It supports real-time data and allows users to analyse price movements using a range of technical indicators and drawing tools. What makes it practical, especially for Kenyan investors, is that it does not require heavy software installation — all you need is internet access and a device. Whether you’re following NSE-listed firms or international assets, TradingView serves as a one-stop hub for market analysis.
For Kenyan traders, TradingView provides access to both local and global markets, enabling a broad view for diversification. Its free account option is ideal for new investors starting on a tight budget. Besides, TradingView’s social community lets users see trade ideas from other traders, which can be particularly helpful when learning market patterns or confirming analysis. Integration with Kenyan brokers and mobile alerts means you stay informed even while on the move.
TradingView gives you the choice to track multiple asset classes. You can watch NSE stocks, forex pairs like USD/KES, cryptocurrencies such as Bitcoin and Ethereum, and commodities including gold and oil. This broad coverage allows Kenyan traders to explore different investment opportunities or hedge their portfolios by following correlated and uncorrelated assets.
Getting started is straightforward. You can set up a free TradingView account by signing up with your email or through social platforms like Google or Facebook. The free account provides access to most charting features and hundreds of indicators without cost, which suits beginner traders in Kenya who want to explore the platform before considering paid plans.
Once logged in, the chart interface is pretty intuitive. The main screen displays the candlestick or other chart types for your selected asset. Key elements include the price axis, timeframes toolbar, indicator panel, and drawing tools. Kenyan traders benefit from the simple design that lets you focus on price action without distraction. For example, you can zoom into short-term price moves during Nairobi trading hours or zoom out to see long-term trends for investment decisions.
Choosing the right asset and timeframe matters for analysis. You can search for assets by name or ticker symbol — for instance, NSE’s Safaricom (SCOM) or forex pair EUR/USD. Timeframes range from one minute to monthly views. Shorter timeframes suit day trading or scalping, while longer ones help with investment planning. For Kenyan investors, combining timeframes offers a clearer picture of price behaviour across different scales.
Starting right with TradingView charts builds a solid foundation for smarter investing by helping you see market moves clearly and apply relevant tools efficiently.
By understanding how to access and set up your first chart, you open doors to a world of detailed market analysis that can inform your trading or investment strategy.
TradingView's key chart features equip Kenyan investors with the tools needed to read market movements and make timely decisions. Knowing how to use different chart types, indicators, and drawing tools can improve your understanding of price action and market sentiment, especially in markets like NSE stocks, forex pairs, and cryptocurrencies.
Candlestick charts are the favoured choice for many traders due to their detailed price information. Each candle shows the opening, closing, high, and low prices for a given time period, giving clear clues about market momentum. For example, a long green candle on Safaricom’s stock suggests strong buying interest during that interval. Candlesticks also form patterns, like ‘doji’ or ‘hammer’, which help forecast potential reversals or continuations.
Line charts draw a continuous line from the closing price of each timeframe. Though simpler, they help quickly identify overall trends without the noise of intra-period price swings. This type works well for investors who want a clear, straightforward view of price direction on assets like US dollar-Kenyan shilling forex rates.
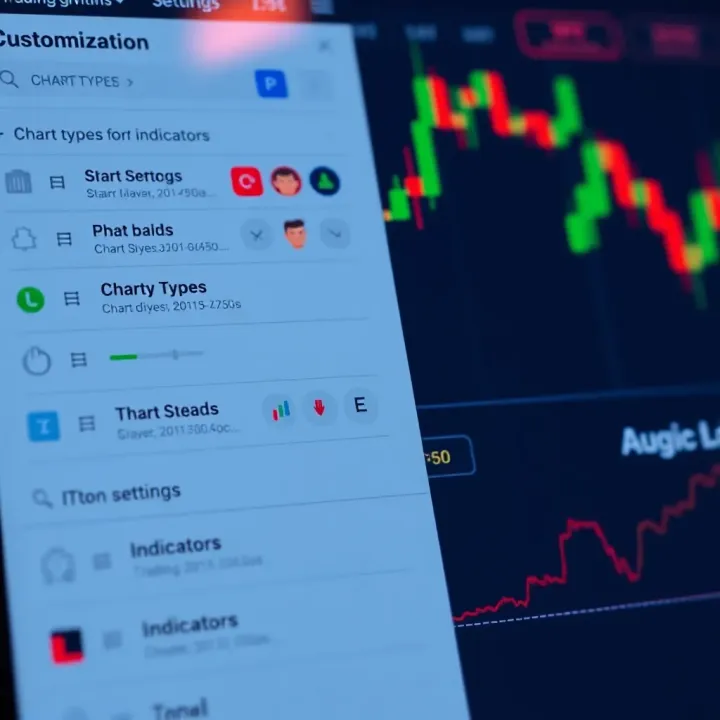
Bar charts and others present price data in distinct formats. Bar charts look similar to candlesticks but use different visual cues for highs, lows, opens, and closes. Traders sometimes use Heikin Ashi charts that smooth price data to spot trends more easily. Kenyan investors dealing with volatile cryptocurrencies might find this smoothing useful to avoid overreacting to short-term dips.
Indicators such as RSI (Relative Strength Index), MACD (Moving Average Convergence Divergence), and Moving Averages are essential for spotting market signals. RSI reveals overbought or oversold conditions, helping you spot when an asset like KCB Bank's stock might pause or reverse. MACD gives trend direction and momentum shifts, especially useful during volatile forex trading hours. Moving averages smooth out price data, clarifying whether the market is trending up or down over days or weeks.
These tools help identify trends and momentum by signalling when buyers or sellers dominate. For example, a rising 50-day moving average supports the idea that a stock is in a strong uptrend. Conversely, if RSI hits 80, the asset might be overbought and due for a pullback.
Combining multiple indicators reduces false signals. If MACD suggests a buy but RSI shows overbought, you might hold off. Kenyan investors trading NSE equities could combine Moving Averages with volume indicators to confirm genuine breakouts.
Drawing trend lines and support/resistance zones lets you visually mark critical price barriers. Trend lines show the general direction, helping you spot breakouts on stocks like Equity Bank. Support/resistance zones mark where price tends to stall or bounce, giving clear entry or exit points.
Fibonacci retracements help estimate potential reversal levels based on previous price swings. Traders apply these to Kenyan shilling forex charts to anticipate where price might pull back before continuing a trend.
Shapes and annotations offer ways to highlight patterns or write notes directly on charts. These are handy to mark earnings dates, Kenya’s economic releases, or key resistance levels. Annotations help keep track of your reasoning behind trades.
Getting familiar with these chart features can help Kenyan traders read market signals better and avoid costly mistakes. Practice using each tool in simulated environments to gain confidence.
Together, learning these features equips you with a toolkit to make better-informed trading or investment choices on TradingView's platform.
Customising TradingView charts lets you tailor your trading experience so it feels natural and efficient. Kenyan investors often face fast-moving markets, whether trading NSE stocks or forex pairs, so having charts that suit your personal style helps you spot opportunities quicker and make clearer decisions. Instead of struggling with default settings that may not highlight what matters, adjusting layouts and visuals makes your analysis sharper and less stressful.
Changing colours and chart background is a simple way to make charts easier on your eyes. For example, when working late at night or in a bright Nairobi office, you might switch backgrounds from light to dark to reduce eye strain. Custom colours for support and resistance zones help you identify critical levels faster; perhaps marking strong support in green and resistance in red makes spotting reversal zones quicker.
Customising candle colours and sizes matters more than many think. By default, green and red candles show price movement, but you can adjust these colours to something you find more intuitive or less glaring, such as blue or grey. Also, changing candle width makes patterns clearer, especially on smaller screens like mobile devices, which many Kenyan traders rely on during their morning commutes in matatus.
Working with dark and light modes gives flexibility based on time of day or personal comfort. Many traders prefer dark mode since it reduces glare and saves device battery, important when power is unreliable. Others favour light mode during daytime for clarity in bright environments. TradingView makes switching seamless, so you can easily balance comfort and visibility wherever you trade.
Saving your preferred setup prevents wasting time every day redoing your chart customisations. Once you have indicators, colours, and tools set the way you like, saving that layout means you open TradingView and get straight to work. This is especially useful for Kenyan traders managing multiple assets, such as following the NSE 20 share index alongside forex pairs like USD/KES.
Loading templates allows for quicker analysis when switching between various strategies or markets. For instance, you may have one template with technical indicators suited for forex trading and another for stocks. Loading these instantly saves the hassle of adding each indicator from scratch.
Sharing chart layouts with others adds value when you collaborate with fellow traders or financial advisors. Say you discover a promising pattern in Safaricom shares; you can export your chart setup and share it so your trusted circle sees exactly what you see. This fosters better discussion and faster decision-making in Kenya’s vibrant trading community.
Customisation transforms generic TradingView charts into powerful tools crafted just for your trading habits. It saves time, improves clarity, and can enhance your market timing.
In summary, investing time in chart customisation means less frustration and more focus on actual trading. Whether it’s colour tweaks, saving layouts, or sharing templates, these simple steps make TradingView work harder for you.
TradingView charts can be a strong ally in your everyday trading, especially for Kenyan investors who juggle local market dynamics with global asset trends. Using these charts consistently helps you catch price changes early, make informed entry and exit decisions, and reduce guesswork. When integrated well into your trading routine, they improve your timing and execution, ultimately protecting your capital and boosting profits.
Price alerts act like your digital watchdog on TradingView. Instead of staring at the screen all day, you set alerts for levels that matter—say, a stock hitting KSh 300 or forex breaking a support level. Once triggered, you get notified, allowing quick action without constant monitoring. For example, if Safaricom shares surge past a resistance point, an alert ensures you can decide to sell or hold without delay.
When trading multiple assets across stocks, forex, or crypto, set too many alerts without organisation, you may feel overwhelmed. TradingView lets you categorise and review alerts by asset or priority. This way, you focus on the critical price points that affect your investment strategy, skipping the noise. Sorting alerts wisely prevents information overload and sharpens your responses.
TradingView’s mobile app sends alerts directly to your smartphone, which is a must-have for Kenyan traders who move around a lot. This makes sure you never miss important price movements during your matatu rides or errands. Mobile notifications, combined with sound or vibration, keep you updated in real-time, making your trading responsive and adaptable, even away from your desk.
The TradingView mobile app offers easy chart access, real-time data, and the ability to add indicators on the go. Whether you are at Nairobi’s CBD or Kisumu’s market, you can quickly check your portfolio, adjust your chart layouts, and track price swings. The app supports most core features found on desktop but with a streamlined interface designed for one-hand use.
With synced accounts, your chart layouts, watchlists, and alerts stay consistent across desktop, mobile, and tablet devices. This means if you lock in a technical setup on your office desktop, you’ll find the same view ready on your phone during a boda boda trip. This seamless sync prevents you from losing track of your analysis and ensures continuity in your trading process.
The desktop version offers a bigger workspace, richer tools, and advanced charting options that mobile can’t fully support. It allows complex indicator layering, multi-chart views, and faster backtesting. For Kenyan traders who want to dig into NSE market patterns or forex volatility, desktop setups offer the precision and comfort needed for thorough study and strategy refinement.
Several Kenyan brokers now integrate directly with TradingView, allowing you to trade directly from the chart platform. This integration streamlines order execution for assets like NSE equities or regional forex pairs. By linking your broker account, you speed up transactions, saving valuable seconds in fast markets.
Adding Kenyan market data from sources like NSE or specific commodities pricing helps contextualise international trends on your chart. By overlaying global forex movements with Kenyan shilling performance or maize prices, you create a fuller picture that guides smarter decisions related to local investments.
Brokerages that accommodate M-Pesa deposits simplify funding your trading account. Rather than bank transfers, you can load your account instantly using M-Pesa, a system Kenyans trust and use daily. This quick deposit ability means fewer delays after detecting a trade opportunity on TradingView charts.
Consistent use of alerts, mobile access, and integration with local tools turns TradingView from a simple charting service into a practical trading partner you can trust every day.
Using TradingView charts effectively means recognising common stumbling blocks and learning how to navigate them. Overcomplicating your charts with too many indicators or ignoring market changes can easily lead to confusion and missed opportunities. This section helps Kenyan traders stay focused by managing these challenges well.
When first using TradingView charts, it’s tempting to apply several technical indicators at once—RSI, MACD, moving averages, Bollinger Bands, and more. However, too many indicators crowd your view and create conflicting signals. Sticking to a few that suit your trading style helps keep things clear. For instance, many local forex traders rely mainly on moving averages and RSI to gauge trend direction and overbought or oversold conditions. This simplicity avoids confusion and speeds decision-making.
Charts cluttered with dozens of indicators, coloured lines, and shapes can slow you down, especially when trading fast-moving markets. A clean, readable chart allows you to spot important signals quicker. Think of it like following a football match: too many stats on screen distract from the actual gameplay. Choose only those tools that add value for your analysis rather than every available tool TradingView offers.
Every trader has a method—scalping, swing trading, or long-term investing—and your indicators should match that. For example, if you focus on short-term trades in the NSE 20 share index futures, momentum indicators like the MACD might carry more weight than long-term moving averages. By prioritising signals tailored to your strategy, you reduce noise and make smarter trades.
Markets in Kenya and globally change constantly. A setup that worked last week might fail this week due to new economic reports or political events. Regularly revisiting your charts and adjusting your indicators ensures your analysis stays relevant. Kenyan investors following currency pairs like USD/KES benefit by checking charts daily, especially around Central Bank announcements.
Some markets experience price swings more than others. Forex markets can be quite volatile, while stocks may move slowly. Using TradingView, you can switch between different time frames to suit volatility levels—shorter periods for volatile markets and longer for steadier ones. This flexibility helps you avoid false signals when prices jump unpredictably.
One handy feature on TradingView is the public ideas section where traders worldwide share charts and strategies. Kenyan traders can benefit by observing what others suggest about local and global markets. It’s a chance to learn from experienced investors and spot trends you might have missed. Just remember to view these ideas as inspiration, not gospel, and always verify before acting.
Effective chart use comes down to focusing on the essentials, keeping your analysis up to date, and learning continuously. This way, TradingView becomes a powerful companion rather than a source of overwhelm.
Discover how Maven Trading operates in Kenya's markets 📈, its investment role, key strategies, and what Kenyan investors must know before starting their journey 🌍.
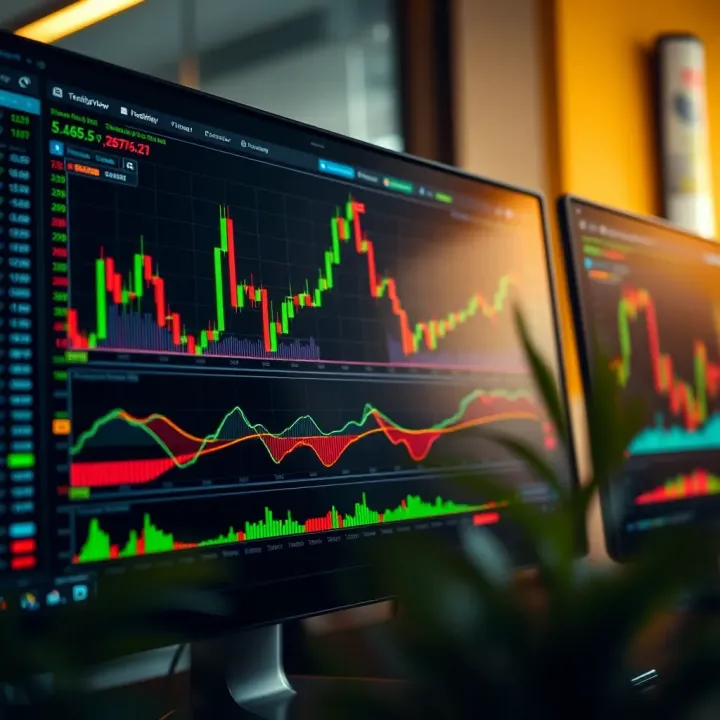
📊 Discover how to use TradingView charts like a pro! Learn about chart types, key indicators, and smart tools to boost your trading success in Kenya. 📈
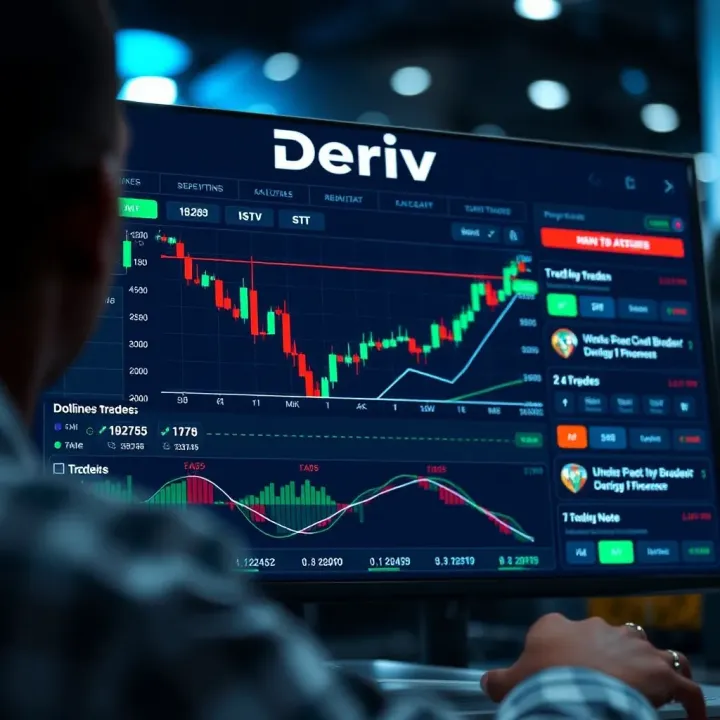
Explore Deriv Trade in Kenya 🇰🇪—learn trading types, strategies, risks, and regulations to navigate this platform confidently and safely 📈💡
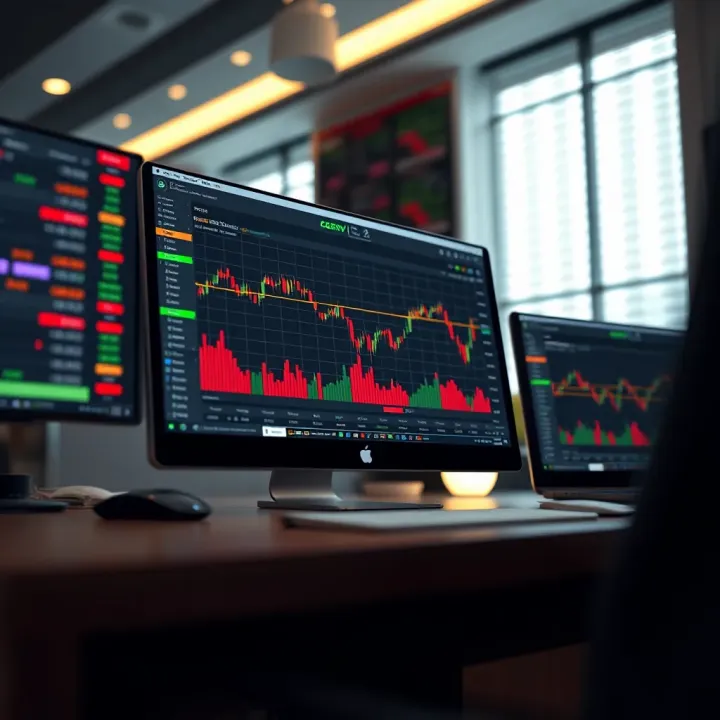
Discover how Deriv Trader offers Kenyan investors diverse trading tools and options 🌍. Learn tips to navigate confidently and make smart financial moves📈.
Based on 9 reviews