
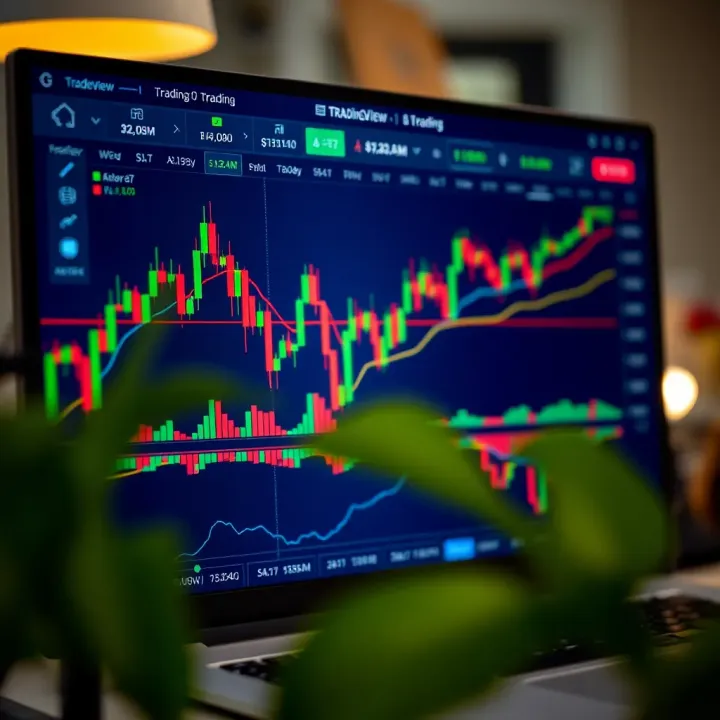
How to Use TradingView for Binary Options Trading
📊 Learn how to use TradingView charts for smarter binary options trading in Kenya. Discover key tools, strategy tips, and broker integration for better trades.
Edited By
Isabella Clarke
TradingView.com has rapidly become a go-to platform for traders and investors seeking reliable charting tools. Its user-friendly interface and broad feature set allow you to analyse price movements, monitor trends, and make data-driven decisions efficiently.
At its core, TradingView provides access to real-time market data across various asset classes including equities, Forex, commodities, and cryptocurrencies. What sets it apart is the ability to customise charts with multiple indicators, drawing tools, and timeframes which suit both novice and seasoned users.
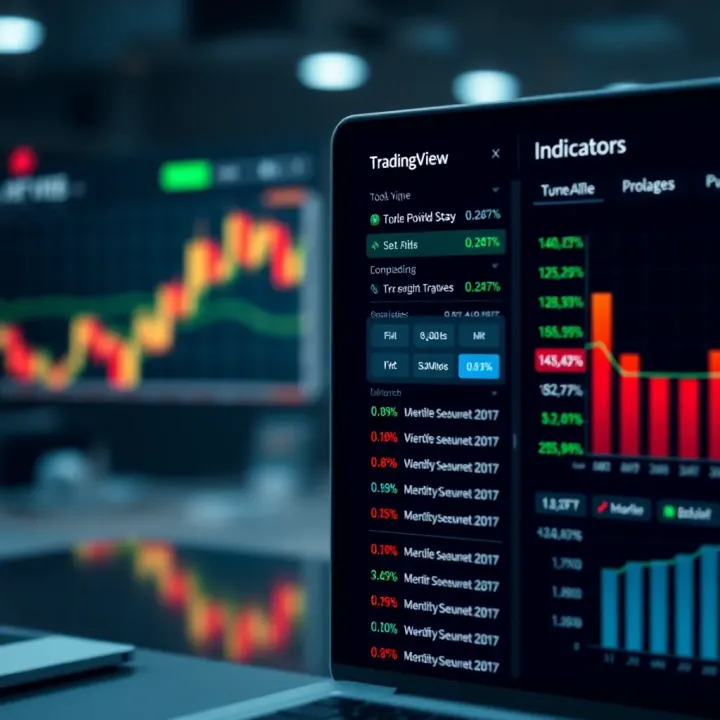
Understanding the chart interface is your first step. You'll find the central price chart offers several view modes like candlestick, line, and bar charts. Each serves a different analysis style — for example, candlesticks vividly show open, high, low, and close prices, making patterns easier to spot.
Familiarise yourself with the toolbar on the left; it holds essential tools such as trendlines, Fibonacci retracements, and text annotations. Using these tools, you can mark support and resistance levels or highlight breakout points directly on the chart.
Timeframes range from seconds to months, enabling you to zoom into short-term price action or take a broader view of market cycles. Kenyan traders often switch between 1-hour and daily charts to spot both intraday opportunities and longer trends.
Moreover, TradingView’s custom indicators and alert system enhance your market monitoring. You can create alerts based on price levels, technical triggers, or custom-built scripts to receive timely notifications on your phone or email, helping you act promptly without constant screen-watching.
Here are three practical tips to maximise your use of TradingView charts:
Use multiple layouts: Open two or more charts side by side to compare different assets or timeframes quickly.
Save your preferences: Once you set your favourite indicators and drawing styles, save the setup to avoid repeating configurations.
Leverage community scripts: Explore publicly shared indicators created by other traders to broaden your analysis toolkit.
Getting comfortable with TradingView's charting platform will sharpen your market insight and improve your investment timing. In the sections ahead, we’ll break down specific functions and strategies to make the most of this powerful tool.
TradingView has become a go-to platform for traders and investors in Kenya and beyond thanks to its rich set of charting tools and real-time market data. Understanding the basics of TradingView's charting platform is essential for anyone aiming to make informed decisions in the markets. This section introduces you to the platform, explaining why it matters and showcasing how it fits into your trading or investment routine.
TradingView.com offers an interactive environment where you can view, analyse, and share stock charts, forex pairs, commodities, and cryptocurrencies on a single interface. It collects data from multiple exchanges worldwide, delivering live price updates without the lag often found on less sophisticated websites. For example, a trader tracking the Nairobi Securities Exchange (NSE) can quickly compare local stocks like Safaricom or East African Breweries Limited with regional or global instruments on one screen.
Beyond basic charting, TradingView provides social features where traders and analysts publish ideas and insights — fostering a community that shares practical knowledge. This is particularly useful in Kenya's growing investing circles where peer guidance often complements formal financial advice.
Getting started with TradingView requires creating a free account, which unlocks many useful functions such as saving chart layouts and setting alerts. Signing up is straightforward: provide your email, choose a secure password, and confirm your registration. Once logged in, you can access personalised features tailored to your trading style and preferences. While free access offers a strong foundation, upgrading to a paid subscription gives tools like extended chart histories and extra indicators — valuable options for serious traders.
After signing in, you land on the TradingView homepage, from where you click on the 'Chart' tab located at the top menu. This action opens the core charting interface, displaying the default instrument or allowing you to input the ticker symbol of your choice. For example, typing “NSE:EQTY” loads Equity Group Holdings' stock chart. The interface is designed to be intuitive, letting users easily switch between different assets or timeframes.
TradingView’s platform is accessible via both desktop browsers and mobile apps for Android and iOS. Desktop users tend to benefit from larger screen space and faster navigation, ideal when working with many indicators or multiple charts simultaneously. On the other hand, the mobile app provides handy on-the-go access, perfect for quick checks and setting alerts from anywhere, including matatu rides or lunchtime breaks. Though the mobile experience is slightly pared down, it still supports most essential functions, making it a flexible tool for Kenyan traders constantly on the move.
Starting with TradingView's charting platform sets a solid groundwork for any market analyst. Knowing how to create an account, navigate the charts, and choose between mobile or desktop access ensures you don't miss crucial market moves.
TradingView charts are particularly valuable because they package a wide range of market data and tools into an interface that's clear and flexible. Understanding the key features and layout helps traders and investors act fast and see trends without getting lost in clutter. For example, a busy NSE equities trader can quickly spot daily price moves using the price and time axes, while an analyst might switch between chart types to match their strategy.
The price axis runs vertically, displaying asset prices, while the time axis runs horizontally, showing time progression. These axes anchor your view, allowing you to see how prices evolve over specific periods. For instance, when watching Safaricom’s stock on NSE, the price axis shows fluctuations in shillings, and the time axis helps identify trading hours or days.
Moving beyond basics, TradingView offers several chart types—candlestick, line, bar, and more. Candlestick charts are the most popular among Kenyan traders because they provide rich information: open, close, high, and low prices within each period. A candlestick showing a long wick might indicate market uncertainty, useful when evaluating commodities like tea or coffee futures. Line charts offer a simpler view—connecting closing prices—and work well for spotting long-term trends, such as forex rates for KES/USD.
At the top or side, the toolbar and control panel pack essential tools: zoom controls, drawing implements, indicator selectors, and save options. This layout keeps analysis handy without overloading your view. Suppose you want to draw a trend line or add the Relative Strength Index (RSI); you just pick the tool from the toolbar, apply it, and adjust settings. For Kenyan traders relying on quick decisions, this saves valuable time.
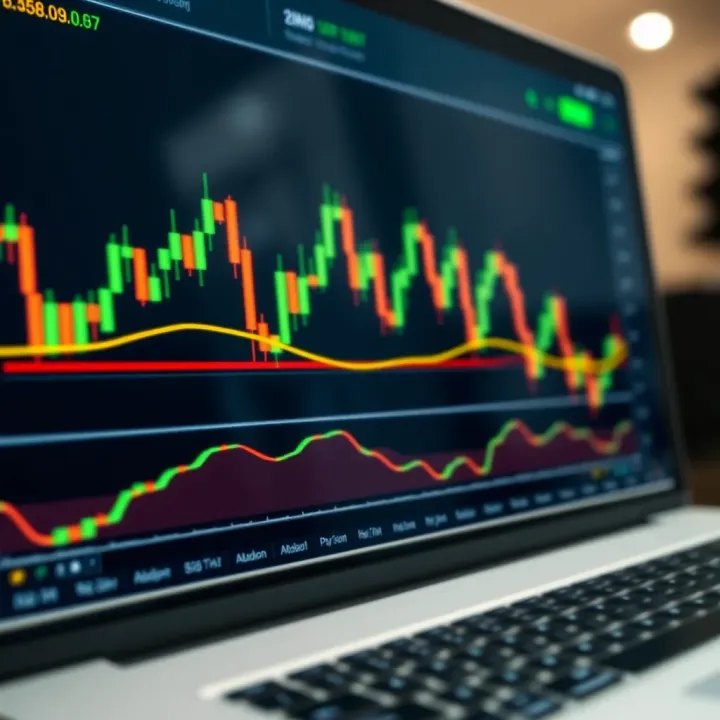
Choosing colour themes and backgrounds isn’t just about personal preference—it helps reduce eyestrain during long analysis sessions. TradingView allows switching between dark and light themes, which is handy given different ambient lighting conditions. A daylight trader in Nairobi might prefer a light background, while a night trader in Mombasa could switch to dark mode to avoid glare.
Setting chart intervals and timeframes tailors the chart data to your strategy. You might look at 5-minute candles for intraday trades or daily candles for swing positions. For example, a forex trader assessing KES/EUR volatility may zoom into 15-minute intervals to catch rapid moves, while a long-term investor analysing NSE 20 Index would benefit from weekly intervals.
Finally, adjusting scale and zoom sharpens your focus. Pinching in or out zooms into specific price areas or broadens your market view. Sometimes, you want to compare a sharp price drop closely, like a sudden sell-off in oil prices affecting East African markets, and other times, you want an overview of overall trends for better context.
Mastering these features transforms TradingView charts from mere graphs into actionable tools. Your choice of chart type, intervals, and layout really shapes how you read market signals and make informed trades.
By familiarising yourself with TradingView’s key components and personalising settings to your style, you ensure clarity in decision-making and efficiency in your trading routine.
TradingView charts offer wide-ranging analysis tools that help traders and investors spot opportunities and manage risks. These tools go beyond just viewing price movements; they enable detailed technical analysis that supports informed decision-making. For Kenyan traders handling NSE stocks or East African forex pairs, mastering these analysis functions is key for reliable market insight.
TradingView supports many common technical indicators such as Moving Averages (MA), Relative Strength Index (RSI), and Bollinger Bands. For example, an investor watching Safaricom Plc (NSE: SCOM) might add a 50-day moving average to gauge medium-term price trends. The RSI helps determine whether the stock is overbought or oversold, which is useful to time entry or exit points. These ready-made indicators simplify spotting momentum, volatility, and trend strength without complex calculations.
Adding indicators on TradingView is straightforward: simply click the indicator button on the chart toolbar, search for your preferred tool, then click to apply. Removing is just as easy — right-click on the indicator line or find it listed under the chart's indicator panel to delete it. This flexibility allows users to test various technical setups and quickly adjust their analysis, keeping the chart clean and focused only on relevant information.
For traders wanting bespoke tools, TradingView permits creating or importing custom indicators using Pine Script. Suppose a Kenyan forex trader wants to combine standard MACD with volume-weighted averages to suit local market behaviour. Writing a Pine Script for this enhances precision in analysis beyond the default offerings. The active community also shares scripts, so users can adopt or tweak popular models to fit their own strategies.
Drawing tools like trend lines help highlight support and resistance levels clearly. For instance, when analysing Equity Group shares, you might draw an ascending channel capturing the stock's recent uptrend. These visual guides offer insight into potential reversal points or confirmation of momentum, making it easier to recognise when a price movement is genuine or just noise.
Fibonacci retracement levels allow traders to spot expected pullback zones during price corrections. A trader following KCB Group might apply these lines after a strong rally to anticipate where the price could bounce back. This is particularly handy during volatile periods, letting investors plan entries more precisely rather than guessing blindly.
Shapes such as rectangles, ellipses, and arrows, combined with text annotations, let traders mark chart areas for patterns or events. Recording these notes directly on the chart supports a better review process. For example, an investor might annotate an important earnings release date or note a breakout point that triggered their trade. These visual cues simplify tracking complex market factors at a glance.
Effective use of technical indicators together with drawing tools equips traders to make grounded market calls rather than relying solely on gut feeling or hearsay.
Using these analysis features on TradingView enhances a trader’s ability to dissect market conditions, ultimately leading to more confident, data-backed decisions.
TradingView charts offer Kenyan traders a powerful platform tailored to analyse local markets alongside global opportunities. For those invested in Nairobi Securities Exchange (NSE) equities, East African Community (EAC) commodities, or forex pairs, TradingView not only simplifies access to real-time data but also provides customised tools suited for Kenya's market environment. This section highlights practical ways Kenyan traders can extract real value from TradingView's features by weaving local market specifics into their trading strategies.
Nairobi Securities Exchange stocks and indices form the backbone of Kenyan investment portfolios. TradingView's interface allows traders to monitor NSE 20 Share Index, NASI, and various blue-chip equities like Safaricom, KCB, and Equity Bank. Users can analyse price movements, volume, and technical patterns directly on TradingView charts. For example, tracking Safaricom's candlestick charts alongside moving averages helps identify entry points and trend reversals specific to NSE market cycles.
More importantly, TradingView's alert function aids traders who juggle daily business or commute by matatu, so they don’t miss key price levels. Regularly updating charts with NSE market data helps users stay ahead in the fast-moving Kenyan stock scene.
East Africa’s rich commodity markets, including tea, coffee, and maize, are integral for traders focusing on agri-commodities. TradingView supports tracking commodity prices listed under EAC regional exchanges, integrating data useful to Kenyan traders who want exposure in local export-driven sectors.
Additionally, forex traders rely on TradingView to watch shilling exchange rates against USD, EUR, and regional East African currencies like the Tanzanian shilling or Ugandan shilling. This data is crucial for importers, exporters, and forex speculators dealing with currency fluctuations affecting margin calculations and profitability.
Kenyan traders benefit from connecting their TradingView insights with Kenya Revenue Authority (KRA) regulations and Central Bank of Kenya (CBK) announcements. Traders can align trading strategies with periods around tax changes, interest rate decisions, or Central Bank interventions that affect liquidity and market sentiment. Although TradingView doesn’t directly pull KRA or CBK data, combining official releases from these bodies with TradingView’s market charts can help traders anticipate market shocks.
For example, CBK’s hikes in Kenyan shilling policy rates often reflect almost immediately in currency pair charts and NSE banking sector stocks. Being alert to such correlations sharpens risk management for local investors.
Most Kenyan traders fund their brokerage accounts using mobile money services like M-Pesa. While TradingView is primarily a charting platform without integrated account funding, many Kenyan trading platforms (NSE brokers or forex firms) accept deposits via M-Pesa, facilitating seamless transaction flows.
Traders can use TradingView to analyse markets and then execute trades via local brokers using M-Pesa or mobile banking apps. This local payment integration reduces transaction delays and encourages quick response to TradeView’s real-time alerts. Knowing how to navigate between the chart interface and payment platforms saves time and capitalises on timely market moves.
In many parts of Kenya, internet connectivity may not be consistently fast. To manage this, traders should adjust TradingView’s chart settings to lower resolution or fewer indicators when data speed dips. Using minimal chart complexity conserves bandwidth and improves load times, especially during peak matatu commuting hours or in rural areas.
Turning off auto-refresh and manually updating charts also helps in conserving data and avoiding interruptions. Kenyan traders can benefit by keeping key charts saved on the desktop version for offline reference whenever possible.
While TradingView works best online, Kenyan users can export chart images or data snapshots for offline analysis. Using screenshots during reliable connectivity allows traders to review patterns without repeated data usage.
Moreover, investing in some desktop-based charting software as backup, or keeping printed analysis sheets, especially for slow network zones in the shambani, is advisable. This hybrid approach ensures continuous market study despite connectivity hiccups.
Consistent market access and data integration—tailored to Kenya’s realities—empowers traders to react timely and trade confidently using TradingView charts.
By focusing on local market specifics, payment methods, and practical connectivity solutions, Kenyan traders will get the utmost value from TradingView’s powerful charting platform.
TradingView offers more than just charting; its advanced features and community tools enhance your trading experience by adding real-time alerts, collaborative insights, and interactive discussions. For Kenyan traders and investors, leveraging these tools can make market analysis faster and more connected with other market players, whether you’re following NSE equities or regional forex and commodities.
Setting price and indicator alerts allows you to stay on top of market movements without constantly watching the screen. For instance, if you are tracking Safaricom shares on the NSE and want to know when the price hits KSh 35, you can set an alert to notify you via email or mobile notification. Similarly, alerts can be based on technical conditions like the Relative Strength Index (RSI) crossing a certain threshold, helping you catch potential buy or sell signals instantly.
Managing and customising alerts is important to suit your trading style. You can organise alerts by asset, priority, or time of day, making sure you don’t get overwhelmed by too many notifications. Alerts can also be customised to trigger once or several times, and you can choose to receive them on multiple devices. This flexibility means you can keep track of crucial signals even while moving around Nairobi or working offline using mobile data.
Sharing charts and analysis with peers or clients builds credibility and invites feedback. For example, you might post your analysis of the NSE 20 stock index and invite other Kenyan traders to give their take, improving your understanding and strategy. You can also publish annotations directly on the charts to highlight key support and resistance levels, making your ideas clearer.
Following expert traders helps you learn from others who have proven success in the markets. TradingView allows you to see public trade ideas and watchlists from professionals, so you can observe how they analyse sectors like agriculture commodities or forex pairs like USD/KES. Relying on a trusted expert’s insights can complement your research, especially if you’re new to technical analysis.
Participating in discussion forums connects you with a wider trading network beyond analytics. Kenyan traders often share local market updates, regulatory news, or tips related to local payment methods like M-Pesa-enabled trading accounts. These forums foster a sense of community, making you less isolated in your trading journey and more informed about market nuances in East Africa.
Using TradingView's community and alert features turns your market analysis from a solo task into an interactive, real-time experience, helping you make faster, smarter trading decisions.
The blend of advanced tools with peer engagement on TradingView truly expands your trading toolkit, making it easier to react swiftly and learn continuously.
📊 Learn how to use TradingView charts for smarter binary options trading in Kenya. Discover key tools, strategy tips, and broker integration for better trades.
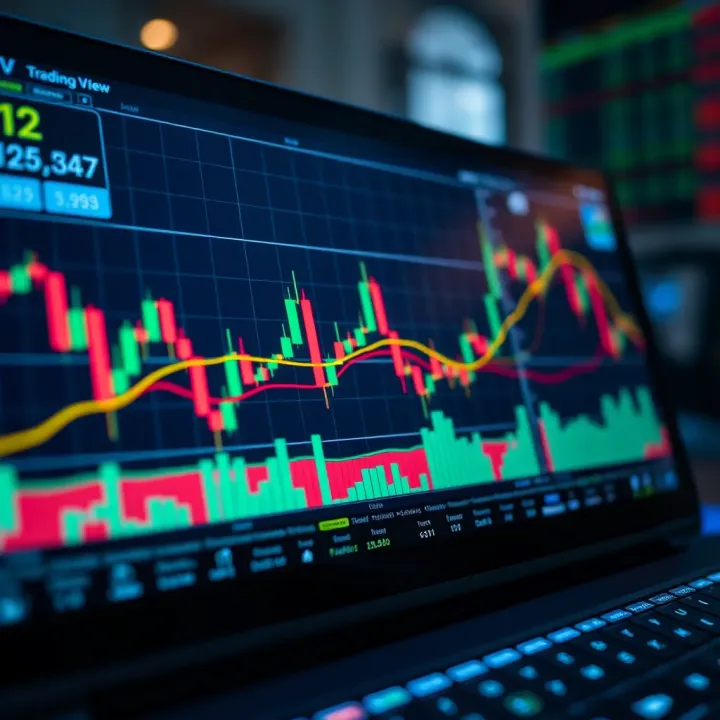
Discover how Deriv TradingView blends technical tools with Deriv for smarter trading 🇰🇪 Strategies and tips to boost your market moves 📈
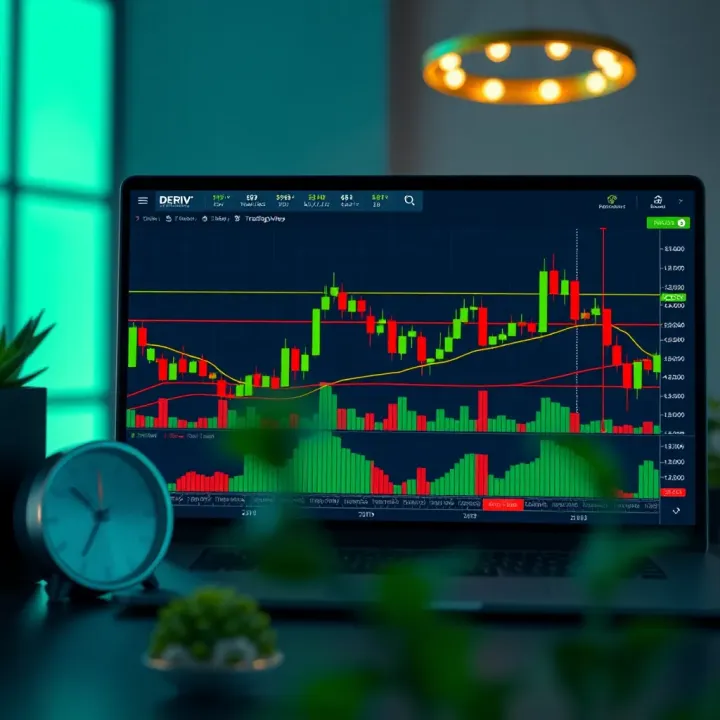
📊 Learn how to use Deriv with TradingView effectively! Get setup tips, strategy advice, and risk management tools tailored for Kenya traders.
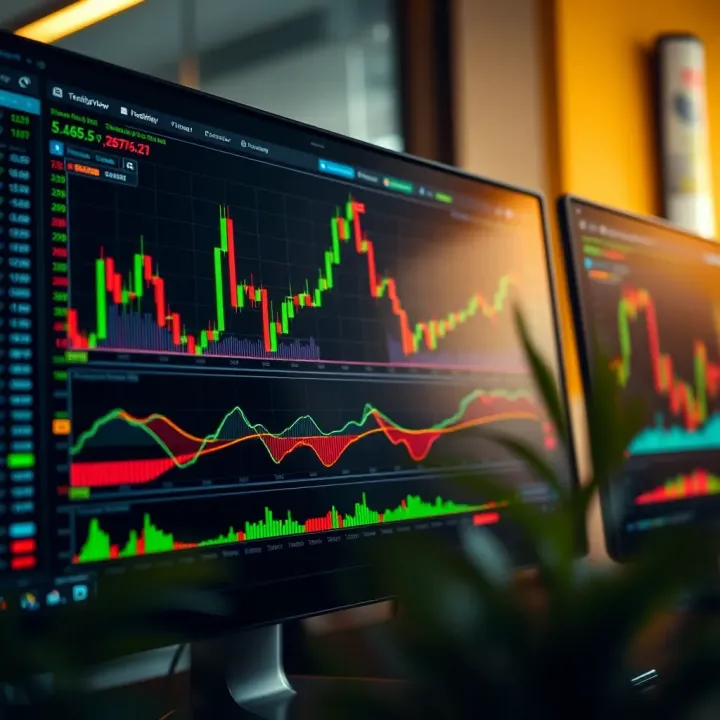
📊 Discover how to use TradingView charts like a pro! Learn about chart types, key indicators, and smart tools to boost your trading success in Kenya. 📈
Based on 8 reviews