
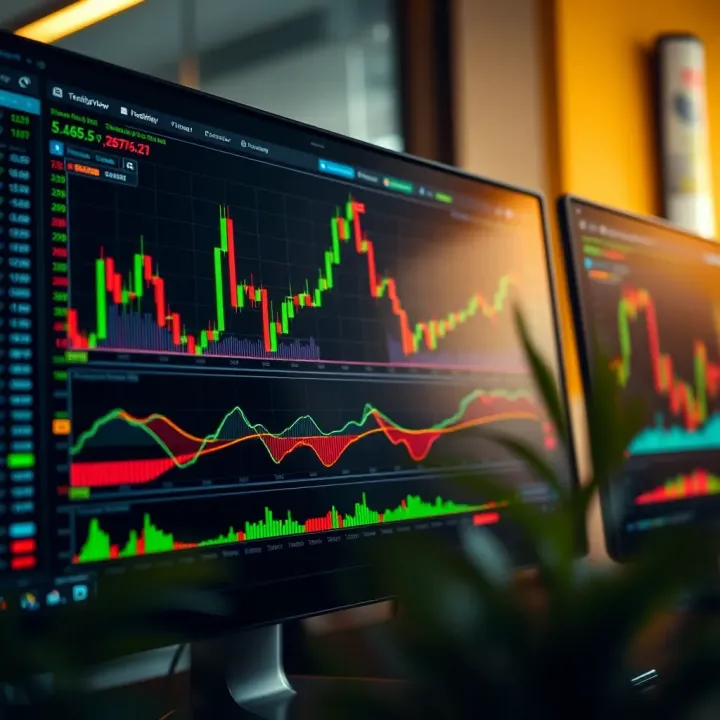
TradingView Charts Guide for Kenyan Traders
📊 Discover how to use TradingView charts like a pro! Learn about chart types, key indicators, and smart tools to boost your trading success in Kenya. 📈
Edited By
Oliver Thompson
TradingView.com has quickly become a go-to platform for traders and investors who need reliable, easy-to-use charts. Kenyan traders, in particular, find it useful because it covers a wide range of markets—from local NSE stocks to international commodities and cryptocurrencies. Whether you're new to trading or an experienced analyst, understanding how to make the most of TradingView charts can sharpen your decision-making.
At its core, TradingView provides interactive web-based charts that go beyond simple price tracking. You can customise charts to suit different trading styles by selecting various chart types and technical tools. For instance, switching between candlestick and line charts offers valuable perspectives depending on what kind of price action you want to study.
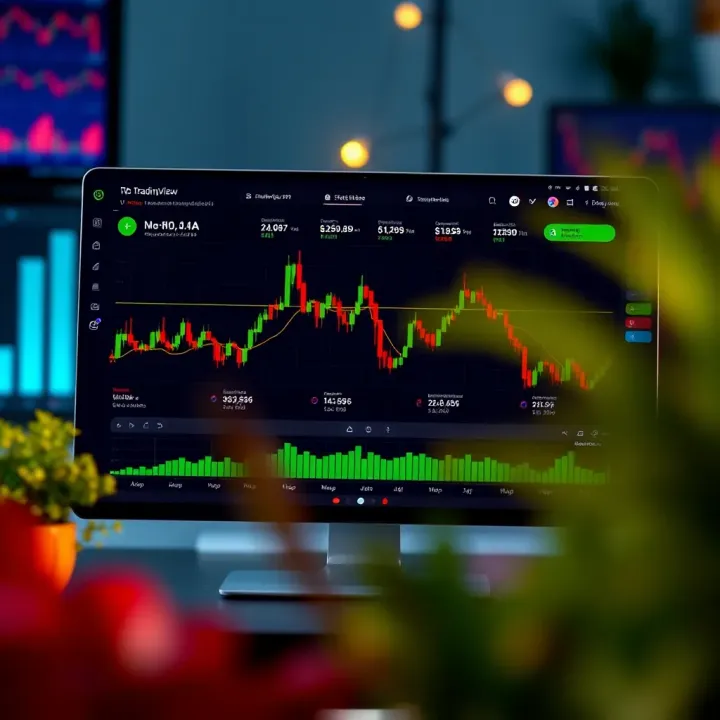
Local Kenyan traders benefit from its ability to integrate with brokers who support global markets, while also tracking NSE equities. This dual capability is handy if you’re juggling investments across several asset classes.
Access to real-time data and historical price trends
Multiple chart layouts for comparing assets side-by-side
A vast library of technical indicators like moving averages, RSI, and MACD
Social features where you can follow expert analysts and share insights
For Kenyan traders relying heavily on mobile connections and variable internet speeds, TradingView’s browser-based platform works smoothly, even on modest devices. You only need a stable internet connection and a device like a smartphone, tablet, or PC.
The platform's user-friendly design allows you to save different chart templates, set alerts based on your preferred criteria, and test trading ideas before risking capital. All these tools matter when markets can shift quickly, and informed choices mean the difference between profit and loss.
In short, having a good grasp of TradingView charts equips Kenyan traders to read markets better, time their trades well, and manage risks efficiently. The following sections will break down the types of charts, essential tools, and how to customise settings specifically for traders in Kenya’s unique financial environment.
Understanding TradingView.com and its charting platform is vital for Kenyan traders because it offers powerful and user-friendly tools that help analyse financial markets. This overview provides context on what TradingView is, who it serves, and why it matters, especially to traders in Kenya dealing with equities, forex, or crypto.
TradingView.com is a popular web-based platform designed for traders, investors, financial analysts, and even entrepreneurs who want to keep a close eye on market movements. Its main goal is to provide accessible and interactive charts and technical indicators that support informed trading decisions. While beginners find it a great learning resource, seasoned traders appreciate the depth of analysis tools it offers.
In terms of accessibility, TradingView's interface runs on browsers and smartphones without needing heavy software installation. This means anyone with internet access in Kenya can use it anywhere — whether at home in Nairobi or on the go in Mombasa. The platform’s global reach also means it provides data on multiple markets worldwide, which matters since Kenyan traders often follow both local and international assets.
For Kenyan traders, TradingView is relevant because it covers Kenyan stocks listed on the Nairobi Securities Exchange (NSE) alongside forex pairs like USD/KES, commodities like coffee and tea futures, and cryptocurrencies popular in Kenya such as Bitcoin and Ethereum. This mix allows local traders to monitor familiar markets and global trends in one place, saving the hassle of juggling different apps. It’s this compatibility with local realities that gives TradingView an edge for Kenyan users.
One of TradingView’s standout features is its real-time market data. Kenyan traders benefit from seeing price movements and volume changes as they happen, not with delays. This speed is crucial for forex trading during overlapping market hours, such as London and Nairobi times, where swift reactions can protect profits or cut losses.
The platform supports a wide range of instruments — from stocks listed on NSE or JSE (Johannesburg Stock Exchange), to forex pairs, commodities like gold and oil, and popular cryptocurrencies. This breadth means a trader specialising in forex can also explore opportunities in crypto or commodities without switching platforms. For example, a Nairobi-based trader might track the price of coffee futures abroad while simultaneously monitoring the USD/KES rate.
Another practical advantage is TradingView’s cross-device availability. Whether using a laptop at the office, a tablet at home, or a mobile phone while commuting on a matatu, traders can access their charts anytime. The app automatically syncs custom chart setups across devices. This flexibility ensures no missed opportunities just because you’re away from your desk.
TradingView not only brings global markets to your fingertips but also fits neatly into the everyday realities of Kenyan traders, helping you stay ahead no matter where you are or which market you follow.
By understanding TradingView’s key features and strengths, Kenyan traders can get started confidently, making the most of the platform’s tools to improve trading outcomes.
For Kenyan traders, the ability to navigate and customise TradingView charts effectively is more than just a convenience—it can shape how quickly and accurately one reads the markets. TradingView offers a variety of chart types and personalisation settings that help traders tailor their workspace according to their trading style and the instruments they follow.
Being familiar with different chart types allows you to choose the right tools for spotting entry and exit points, while good customisation improves clarity, reduces eye strain, and saves time. Whether you trade NSE stocks or forex pairs during odd hours, controlling your view helps uncover trends that straightforward data lists might hide.
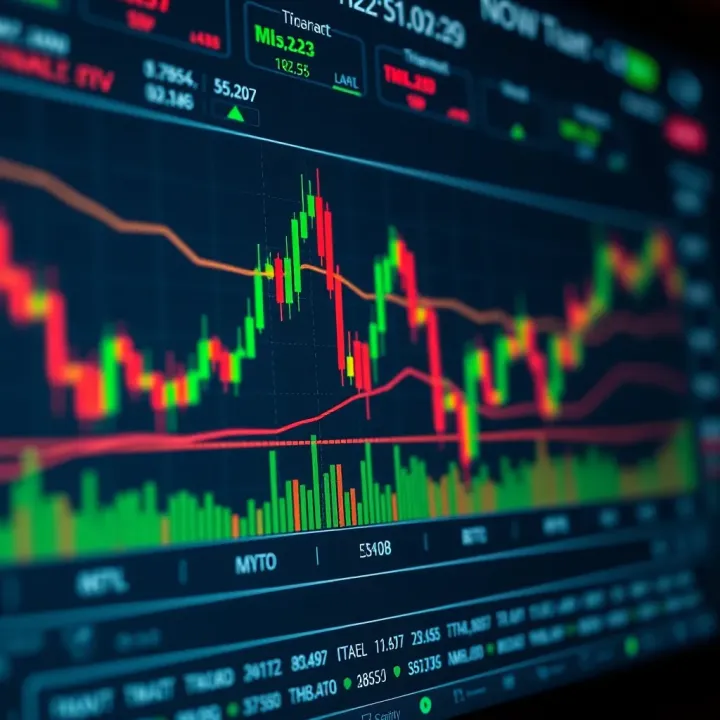
Candlestick charts deliver the most detailed picture of price action. Each candlestick summarises open, high, low, and close prices for a specific timeframe, making it easier to identify bullish or bearish momentum. These charts are especially valuable for Kenyan forex traders watching volatile pairs like USD/KES, as they highlight rapid market swings in ways line charts cannot.
Line and bar charts serve different purposes. Line charts connect closing prices over time, offering a clean, straightforward trend view—great for investors focusing on long-term directions without the noise. Bar charts provide similar information to candlesticks but in a slightly different format, favoured by those who appreciate clear views of price ranges within each period.
Renko and Heikin Ashi charts smooth out price fluctuations to highlight trends more clearly. Renko charts filter out minor price changes by plotting bricks only when price moves significantly, which helps traders in Kenya avoid false alarms during quiet market hours. Heikin Ashi charts average price data to create smoother visuals, assisting users in confirming trend strength before committing to trades.
Changing colour schemes and backgrounds is not merely about aesthetics; it affects how you interpret data at a glance. Traders often prefer dark backgrounds to reduce eye fatigue during late-night market watches, common among Kenyan investors who might check US or Asian markets after working hours. Colour coding also helps distinguish bullish and bearish candles quickly.
Adjusting timeframes and zoom levels allows you to zoom in for minute-by-minute details or zoom out for weekly or monthly trends. For instance, a Kenyan trader trying to catch quick breaks in the NSE 20 Share Index might use 5-minute intervals, while another planning retirement investments prefers monthly reviews. Flexibility in these settings ensures you do not miss critical market signals.
Saving customised templates saves you from starting from scratch every time you open the chart. If you have your preferred set of indicators, colour preferences, and timeframe combinations, saving these as a template means consistent analysis and faster decision-making. This feature especially helps Kenyan traders juggling multiple assets, as switching between templates tailored to each market reduces confusion.
Taking the time to understand and customise your TradingView charts turns raw data into actionable insight—crucial for making timely, informed trades in Kenya's dynamic markets.
Technical analysis tools on TradingView charts are essential for Kenyan traders aiming to make informed decisions in volatile markets. These tools help interpret price movements and market trends, providing practical signals for entry or exit points. Whether you trade shares listed on the Nairobi Securities Exchange (NSE), forex pairs, or commodities, harnessing indicators and chart patterns boosts your trading strategy by offering clearer market insights.
Popular indicators (RSI, MACD, moving averages) are staples in technical analysis. The Relative Strength Index (RSI) gauges momentum by showing whether an asset is overbought or oversold—values above 70 suggest a possible reversal, perfect for timing exits or entries. The Moving Average Convergence Divergence (MACD) tracks momentum shifts through moving averages; crossovers often signal buy or sell chances. Moving averages smooth out price fluctuations, helping identify prevailing trends over daily or weekly timeframes. Kenyan traders might use these indicators to time trades in Safaricom or Equity Bank stocks, where price swings can occur after financial releases.
Trendlines and support/resistance levels serve as visual guides to market behaviour. Drawing trendlines on TradingView shows whether prices are moving upward, downward, or sideways, making it easier to spot breakouts. Support levels indicate where prices tend to stop falling and bounce back, while resistance levels mark points where prices often stall or reverse. For example, a trendline connecting lows in KCB Bank’s stock might highlight a reliable buying zone for Kenyan investors. Identifying these levels helps avoid bad trades by revealing where the market’s pressure lies.
Fibonacci retracements help anticipate potential correction levels after strong price movements. These retracements use horizontal lines derived from Fibonacci ratios (such as 38.2%, 50%, and 61.8%) to signal where prices may stall during pullbacks. If a trader notices Safaricom’s share price has surged, applying Fibonacci levels can signal when the price might retreat before climbing again, aiding in planning timely entries or stop-loss placements. This tool adds an extra layer of precision for those watching the NSE or regional forex pairs.
Common patterns (head and shoulders, triangles) offer straightforward visual clues on potential trend reversals or continuations. A head and shoulders pattern often signals a market top and a likely drop, while triangles point to price consolidation before a breakout. Kenyan traders using TradingView can spot these to prepare for moves in popular stocks or forex pairs. For instance, spotting a triangle in the USD/KES forex chart might alert a trader to a big move ahead, allowing better timing of trades.
Volume analysis is another key element. Volume shows how many shares or contracts have changed hands during a period, confirming the strength behind price moves. Rising prices on increasing volume suggest strong buying interest, while falling prices on high volume may warn of impending decline. Observing trading volume for stocks like Bamburi Cement can uncover whether price increases come from strong investor interest or are weak moves unlikely to hold.
Confirming signals before trades helps reduce risks and improve success. It’s wise to combine multiple technical tools—like matching RSI oversold signals with a support level or confirming volume spike on a pattern breakout—before investing your capital. This approach guards against false signals and aligns your trades with stronger market momentum.
Confirming signals before trades means waiting for more than one indicator or pattern to agree before making a move. For example, a trader noticing an RSI below 30 in a forex pair might hold back until the MACD also signals a reversal. This cautious approach is particularly useful in the Kenyan market, where external factors like local economic news or county-level policies can shift market sentiment quickly.
Using TradingView’s technical analysis tools correctly can sharpen your market timing and risk management, helping you trade with confidence in Kenya’s diverse investment environment.
Integrating TradingView charts with Kenyan trading platforms helps traders make smarter, quicker decisions. It allows seamless use of advanced charts alongside local brokerage accounts, reducing guesswork and improving trade timing. Kenyan traders benefit from combining TradingView’s rich data visualisation with the execution tools offered by local platforms. This integration supports both stock and forex markets that many Kenyans access daily.
TradingView is compatible with several brokerages linked to the Nairobi Securities Exchange (NSE), enabling users to view real-time NSE stock prices and analyse charts directly relevant to the local market. For example, brokers like Faida Investment Bank and SBG Securities provide platforms whose data can be tracked and analysed on TradingView, helping investors spot entry and exit points based on NSE trends. This direct connection lifts the experience beyond generic market data and grounds trading decisions in Kenyan market specifics.
Kenyan forex traders often use brokers such as HF Markets and Pepperstone. While these brokers provide trading platforms, many clients prefer TradingView’s charting tools for its clarity and customisation. You can keep TradingView charts open beside your broker’s interface to cross-check signals and trends. This extra layer of analysis is valuable since forex markets move fast and having reliable chart indicators can prevent rash trades. Also, TradingView supports multiple assets, allowing forex traders to watch pairs beyond the typical USD/KES, such as EUR/USD or GBP/USD, while keeping local currency perspectives in mind.
Certain Kenyan brokers enable linking TradingView directly to trading accounts for quicker trade execution via API integrations. Though this service is growing, firms like Saxo Bank (with regional reach) are beginning to allow such features. For traders, this means spotting a trade setup on TradingView and executing instantly without switching platforms—reducing delays that can cost money in volatile markets. However, Kenyan traders must check broker support for these functions and ensure their accounts are properly secured before linking.
Price alerts on TradingView let you monitor specific stocks, forex pairs, or commodities without staring at the screen all day. For example, if you’re tracking Safaricom shares and want to buy once they hit KSh 30, you can set an alert to notify you instantly. This feature helps Kenyan traders manage their time better, especially when juggling work or other commitments, while still staying on top of market moves.
TradingView’s alert system connects to your mobile phone through notifications or email. This mobile feature ensures you receive timely updates wherever you are—whether in traffic on a matatu or at the shop. Quick alerts empower traders to act promptly on opportunities and avoid missing out due to delayed information. It’s particularly useful given Nairobi’s busy lifestyle and limited desktop access for many.
Alerts can be tailored beyond simple price levels. Traders can customise conditions using indicators like RSI drops below 30 or MACD crossovers, aligning with personalised strategies. For instance, if a forex trader wants an alert when the USD/KES pair shows overbought signals, they can set this up on TradingView. This flexibility helps users fine-tune their trading approach and receive precise signals, reducing noise and focusing only on meaningful events.
Effective integration of TradingView with Kenyan brokers, combined with smart alert setups, keeps traders reactive and informed in a fast-moving market environment. It brings together local expertise with global technology.
By connecting TradingView with local platforms and using its alert systems, Kenyan traders can sharpen their analysis, execute trades faster, and better manage risks linked to NSE and forex markets.
Making the most of TradingView charts requires more than just knowing how to read them. In Kenya’s trading environment, staying sharp with market news, avoiding common analysis pitfalls, and managing your risks carefully can make a big difference in your success. This section offers practical advice tailored to Kenyan traders to enhance decision-making and protect investments.
Following NSE announcements is vital for traders dealing with stocks listed on the Nairobi Securities Exchange (NSE). Changes like corporate earnings reports, dividends announcements, and regulatory updates often cause price swings. For example, a surprise profit warning by a large NSE-listed firm might immediately reflect on their TradingView chart, signalling traders to reconsider their positions quickly.
Tracking global market influences matters too, especially for forex and commodity traders in Kenya. Events like the US Federal Reserve interest rate decisions or oil price changes can ripple through local markets. For instance, a rise in oil prices might increase costs for Kenyan transport companies, affecting their stock prices on TradingView. Thus, keeping an eye on global headlines alongside Kenyan ones offers a fuller market picture.
Incorporating news into technical analysis means blending what charts show with current events. Technical indicators may suggest a buy or sell moment, but if there’s breaking news—for instance, a sudden policy shift by the Kenyan government affecting a sector—it’s wise to adjust your trades accordingly. Using TradingView’s news features alongside chart tools helps traders align analysis with real-world developments.
Over-reliance on indicators can mislead traders if used without proper context. Indicators like RSI or MACD alone won’t tell you everything. For example, an RSI in the overbought zone might suggest selling, but if a Kenyan bank just announced a strong quarterly performance, the price may still rise. Balancing indicator signals with market news and volume confirms is key.
Misinterpreting patterns is another common trap. Chart patterns like head and shoulders or triangles need careful confirmation before acting. Many beginners mistake temporary price moves for pattern completions. Kenyan traders should practise patience, perhaps waiting for the breakout candle or volume spike on TradingView before deciding.
Always test your analysis with multiple factors, not just one signal from the chart.
Importance of risk management is often overlooked but crucial. Kenyan markets can be volatile, and no analysis guarantees profits. Setting stop-loss orders on TradingView protects you from heavy losses. For example, if you buy a stock at KSh 200, placing a stop-loss at KSh 180 limits your potential loss. Keeping your trade size reasonable and diversifying your investments also cushions your portfolio against unexpected shocks.
By combining up-to-date market news, cautious interpretation of charts, and sound risk management, you can improve your trading outcomes using TradingView.com in the Kenyan context.
📊 Discover how to use TradingView charts like a pro! Learn about chart types, key indicators, and smart tools to boost your trading success in Kenya. 📈
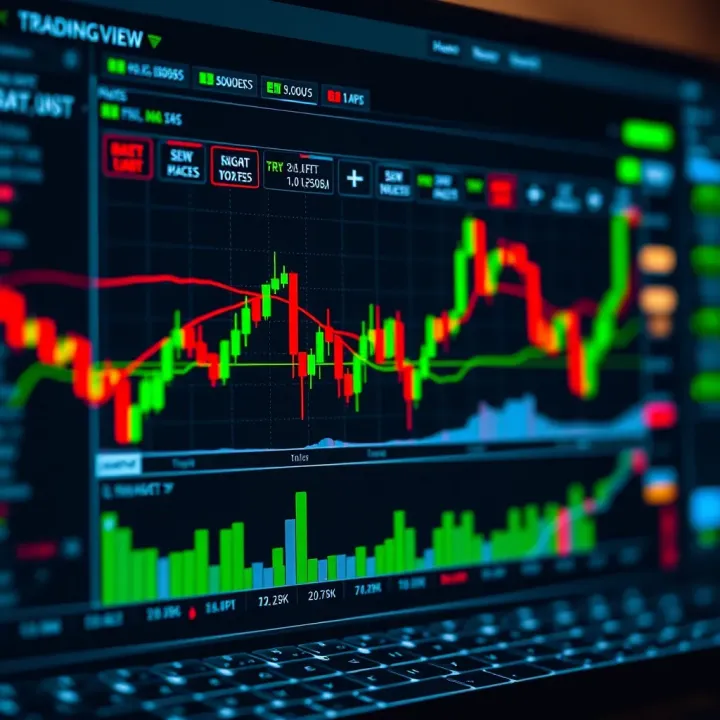
📈 Master TradingView.com with this practical guide for Kenyan traders! Learn to use charts, tools, and local market data to enhance your trading decisions. 🇰🇪
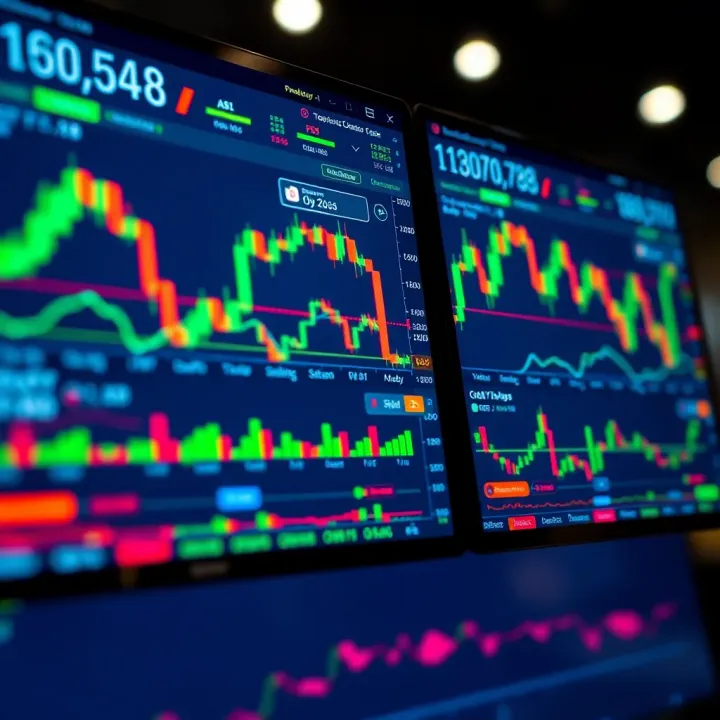
📈 Discover how Kenyan traders can use TradingView to analyse local markets, set up M-Pesa payments, and enhance trading decisions with practical tips and tools.
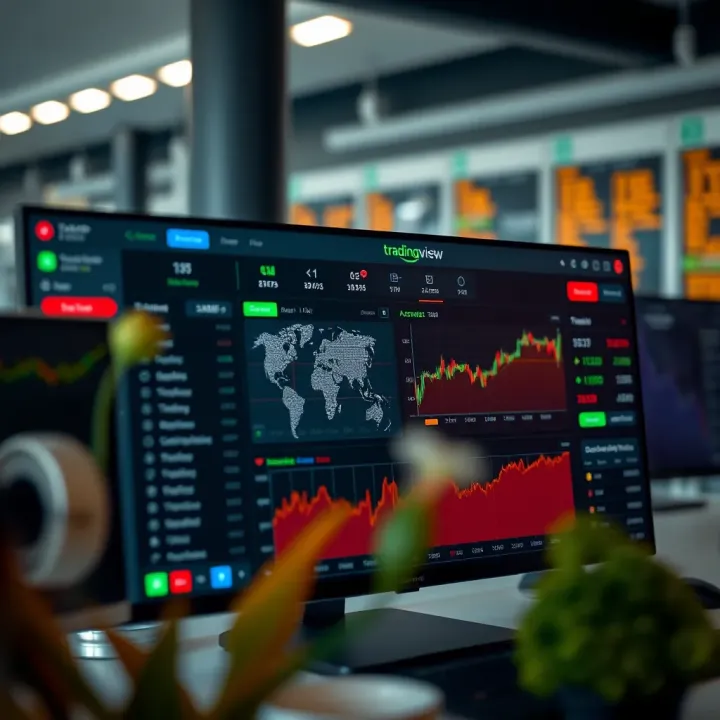
📈 Discover how Kenyan traders can use Tradingview.deriv.com for real-time market data, smooth trading, and smart decisions. Get tips to thrive in Kenya’s market! 🇰🇪
Based on 13 reviews